Red October and 10-year cycles

Last week, the Dow Jones plunged by 800 points on Wednesday and another 500 points on Thursday for a total of 1,300 points. Over the same period, the PSEi was not spared as it fell to a new low for the year of 6,791 before recovering to close at 7,004 for the week. This brings to mind previous market crashes which incidentally happened during the spooky month of October.
Red markets in October
The table below shows the biggest one-day drops of the S&P 500 in October. Out of these sharp one-day, drops, foremost is Black Monday of 1987 when the S&P 500 lost 31.5 percent in a single day. Following the lead of US markets, the PSEi has so far declined 3.7 percent this October. This comes as no surprise as the month of October is historically bad for stocks, with global stock markets typically in the red. In the stock market, the color green signifies that stocks that are up for the day while red means that stocks are down. History tells us that many infamous market crashes happened in Red October.
Table 1. Biggest One-Day Drops of S&P 500 in October (1987-2014)
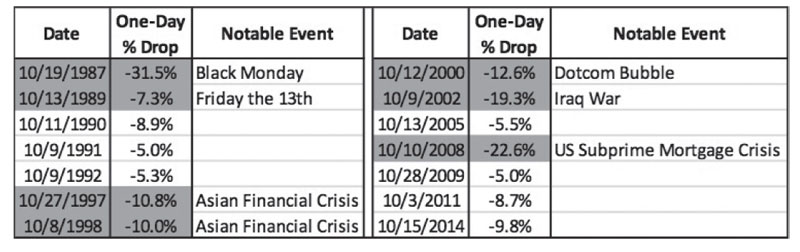
Sources: Bloomberg, Wealth Securities
1987, 1997, 2007: 10-year market cycles?
Some people believe that markets follow a 10-year cycle and that a financial crisis happens every 10 years. This arose due to the market crashes of 1987, 1997, and 2007 that happened in 10-year intervals.
Table 2. Declines from Peak to Trough of S&P 500 and PSEi (10-year cycles)
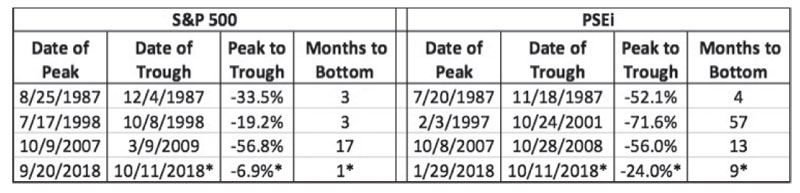
*As of current date
Sources: Bloomberg, Wealth Securities
Uncanny 10-year patterns
It is an uncanny pattern that markets crash every 10 years as seen in the previous table. Black Monday of 1987 was a flash crash caused by traders’ fears over proposed legislation against corporate takeovers and exacerbated by programmed selling. The Asian Financial Crisis of 1997-1998 resulted from asset bubbles and overexposure to floating-rate notes triggered by currency weakness. The 2007-2008 US Subprime Mortgage Crisis was due to lax credit standards and widespread trading in complex financial instruments and mortgage-backed securities. More recently, the US rhetoric against China, which started in 2017, has since unfolded into an ongoing US-China trade war. Last week’s sharp drop has renewed fears that the market is at the end of the 10-year cycle and is due for another major crash. It is important to understand that these massive declines were caused by distinct factors rather than being cyclical in nature. Note that the 2000 dotcom bubble, which caused a precipitous fall of 47.8 percent in US markets, actually breaks the perceived 10-year cycle.
Fundamentals should prevail
After studying the empirical data, we see that the market is seasonally red in October and 10-year cycles resulting from an uncanny pattern caused by different reasons. However, it is too early to state that a new 10-year cycle has started. Depending on the outcome of the US-China trade war, the current market correction may deteriorate into a protracted downturn or reverse into a full-blown recovery.
In the meantime, markets will continue to be volatile, but short-term traders can capitalize on seasonality in the market. As we have written in our book Opportunity of a Lifetime, one can buy during the weak months of August, September, and October in order to take advantage of the stock rally during the strong months of December and January.
As for long-term investors, we would like to emphasize that fundamentals should prevail in investment decisions. Rather than blindly believing in scary Octobers and superstitious cycles, investors should study fundamental factors as these will ultimately determine the overall direction of the market. As seen in the table below, markets eventually recover over the long-run. The S&P 500 takes an average of 33 months to recover and make a new high, while the PSEi recovers after 38 months. Depending on their risk tolerance, time horizon, and asset allocation, investors should look at this turbulent time as an opportunity to buy. History tells us that markets eventually recover.
Table 3. Market Recovery after Crash of S&P 500 and PSEi (1987-2018)
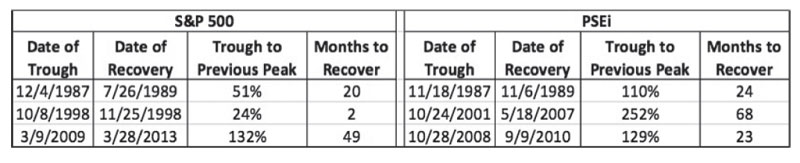
Sources: Bloomberg, Wealth Securities
Philequity Management is the fund manager of the leading mutual funds in the Philippines. Visit www.philequity.net to learn more about Philequity’s managed funds or to view previous articles. For inquiries or to send feedback, please call (02) 689-8080 or email [email protected].


- Latest
- Trending