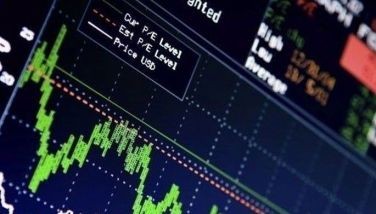
Commentary: Fast inflation likely understating prices during quarantine
LONDON, United Kingdom — The Philippine Statistics Authority (PSA) released last week the inflation figures for January. The agency reported that inflation for the month was at 4.2% the fastest in 2 years. While these figures are concerning, especially during a recession when you need households to spend, it is highly likely that headline inflation data are understating the real state of prices, now that there are many social restrictions in place.
To understand how headline inflation is likely understated, we must first understand how it is measured and what is the rationale for the measurement strategy.
Your economics textbook in college would probably define inflation as “the rate at which the prices of goods and services increase.” But how can a single number represent the price changes of the countless goods and services that individuals consume?
Many of you might know that statistical agencies (such as the PSA) compile an indicator called consumer price index (CPI), which tracks headline inflation. For the compilation of the CPI, statistical agencies choose a base year, which will stand as the reference point for all prices. The base year the PSA is currently using for its CPI is 2012. As an illustration, the CPI for “food and non-alcoholic beverages” subindex in January 2021 was at 137.3. This suggests that prices of food and non-alcoholic beverages items are 37.3% higher than their prices in 2012. The base year is also the year used by statistical agencies to generate their weights. This is where the problem arises.
The CPI is comprised of a basket of goods and services, whose weights are determined by a national surveys called Family Income and Expenditure Survey (FIES) which is conducted every 3 years. Inflation from the CPI is generally a weighted average of price changes across different consumer items in the said basket. Weights are calculated based on the consumption pattern of an “average” household during the base year.
For example, if food and non-alcoholic beverages accounts for 38% of spending for the average household in 2012, then its “weight” in the CPI is 38%. Ultimately, 38% of the price changes reflected by headline inflation is being driven by the price changes in food and non-alcoholic beverages, in this example. The rationale for calculating inflation this way is so that our measures of price changes would reflect the price changes being felt by a “typical household.” Base years are changed every 6 years.
From here, we can see where the problem lies. The goal of headline inflation figures is to reflect the price changes consumers are generally taking. This assumes that there are little to no change in the pattern of household consumption since the base year. Generally, this assumption is fair enough to hold. One can argue that consumption does not change drastically over time. However, this assumption breaks down once you have substantial restrictions in place, such as the community quarantines currently imposed in the archipelago to control the spread of coronavirus.
Quarantine forces change in consumption
The community quarantine forced most, if not all, people to change how they live their lives. Much of the working class were forced to work from home. Kids no longer commute to school. A rational individual would think twice before spending the weekend at the mall. People generally spend less of their budget on recreation. Thus, following these drastic changes in lifestyle, the weights using 2012 as base year are no longer representative of how typical households consume.
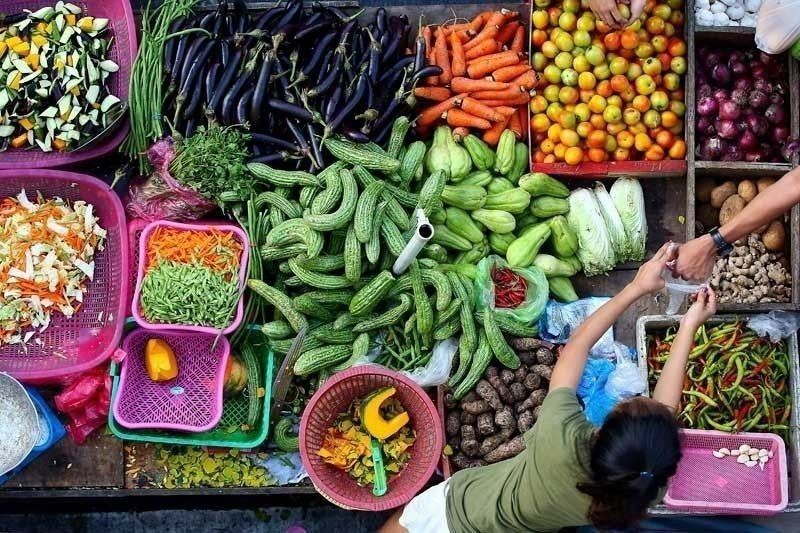
Looking under the hood, one can observe that the price index for food items recorded a substantial increase last month. Meat inflation rose to 17%. Meanwhile, fruit and vegetable costs went up by 21.2% and 6.3%, respectively. Not to be repetitive, but the headline inflation of 4.2% assumes that households spent more or less on the same set of items as they did in 2012. But clearly, with the pandemic around, they did not. There is reason to believe that the relative consumption of food and other essential items are higher now since there are restrictions in place that prevent people from securing them. With bigger weights, a spike in food inflation would have to mean faster inflation.
Under the national accounts, one can observe that the share of food and non-alcoholic beverages to total household spending rose to about 40.6% in the fourth quarter last year, up from just 36.4% in the fourth quarter of 2012 and 35.8% share in same period in 2019. The change in the share of consumption items in measuring household consumption just gives us an indication of the degree of the likely bias.
Emilio Neri Jr., lead economist at Bank of the Philippine Islands, actually raised this concern earlier in the lockdown. He raised the same issues I did regarding the change in household consumption patterns. He noted that inflation from the Implicit Price Index of HFCE may provide a better measure of price movements felt by consumers, considering the index is self-weighting. However, HFCE is released only quarterly, together with the GDP figures. The release of this set of statistics scheduled for release in May. Policymakers likely need price indicators that are more timely in order to swiftly form sound decisions.
This problem in ensuring statistics reflect present realities is faced by not only by PSA, but by all statistical agencies globally. Many efforts are currently being eyed as fix. For instance, statistical agencies in the US, the United Kingdom and Australia are trying to come up with experimental estimates of inflation, where weights are adjusted to reflect household consumption pattern changes during lockdowns.
I would argue that this issue is considerably more important in the Philippines where households are faced with rising prices and a steep recession. Policymakers need to be provided with the necessary information that would allow them to craft strategies to improve the wellbeing of the general population. As Peter Drucker said, “we cannot manage what we cannot measure.”
John Lourenze Poquiz is a PhD student at King’s College London. He holds a master’s degree in advanced economics from the University of Adelaide and a Master of Arts major in Economics from the University of Santo Tomas. Prior to joining King’s College, he worked at the Philippine Statistics Authority, where he was involved in the compilation of the national accounts, several satellite accounts, and other macroeconomic indicators.


- Latest
- Trending