8 of 10 Filipinos satisfied with Philippine democracy
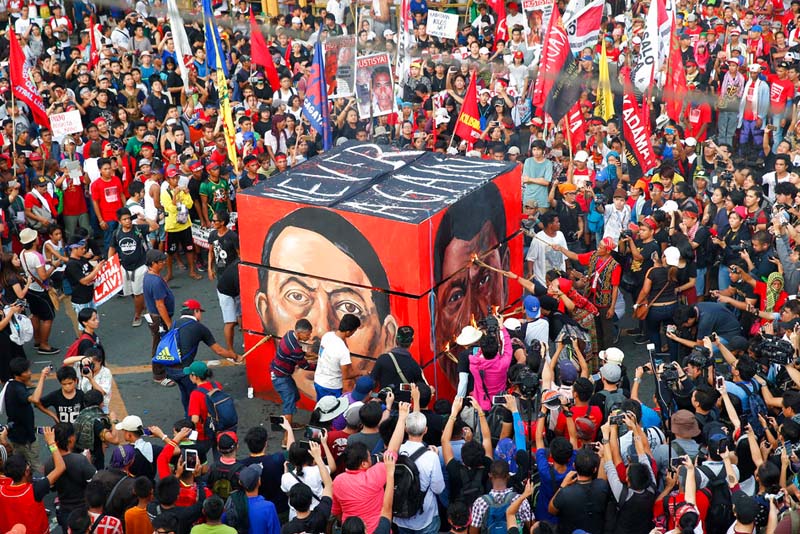
Protesters burn a cube effigy with the faces of the late dictator Ferdinand Marcos and President Rodrigo Duterte during a rally near the Presidential Palace to call for an end to the killings in the so-called war on drugs of Duterte and his alleged "tyrannical rule" in the country, Thursday, Sept. 21, 2017 in Manila, Philippines. AP/Bullit Marquez
Preference for democracy over dictatorship stable
MANILA, Philippines — Public satisfaction with how democracy works in the country dropped in June after reaching a record high in September last year, according to the Social Weather Stations’ latest survey.
Most of the respondents also said "democracy is always preferable to any other kind of government,” the SWS reported.
The poll, which was conducted on June 23-26 via face-to-face interviews with 1,200 adults, found 80 percent satisfied with the way democracy works.
This was six points below the record-high 86 percent logged in September 2016 and similar to the previous record of 80 percent in June 2013.
The survey has sampling error margins of ±3 percent for national percentages, ±6 percent each for Metro Manila, Balance of Luzon, Visayas and Mindanao.
Election factor
According to the polling group, satisfaction with democracy has been above 60 percent since June 2010, ranging from 64 percent to 86 percent. In contrast, it exceeded 50 percent in only two out of 31 surveys from October 1999 to June 2009.
Its best showings were in October 1992 at 70 percent, July 1998 at 70 percent, June 2010 at 68 percent, and September 2016 at record-high 86 percent. SWS said the peaks during those periods were due to “successful presidential elections.”
"The previous record of 80% in June 2013 was achieved after the May 2013 senatorial elections,” SWS also said.
“On the other hand, satisfaction with the way democracy works was a disappointing 44% in June 2004, which came after the presidential election that year,” it added.
Democracy or authoritarianism?
Meanwhile, the proportion of adult Filipinos who prefer democracy to any other kind of government was at 61 percent in June, similar to 62 percent in September 2016.
Preference for democracy has been above 50 percent since February 2009, reaching a record-high 65 percent in June 2013, the pollster said.
In comparison, respondents who said an authoritarian government is acceptable "under some circumstances” steadied at 19 percent in June. It has been below 20 percent for four consecutive quarters since December 2015.
The proportion of those saying "for people like me, it does not matter whether we have a democratic or a non-democratic regime" rose by two points at 20 percent.
“People's preference between democracy and authoritarianism is a different issue from the degree of satisfaction with how democracy works, and is probed by a separate question,” the SWS noted.
The question on "satisfaction in the way democracy works" originated in the Eurobarometer surveys and is also in standard use in Latin American and Asian Barometer projects.


- Latest
- Trending